


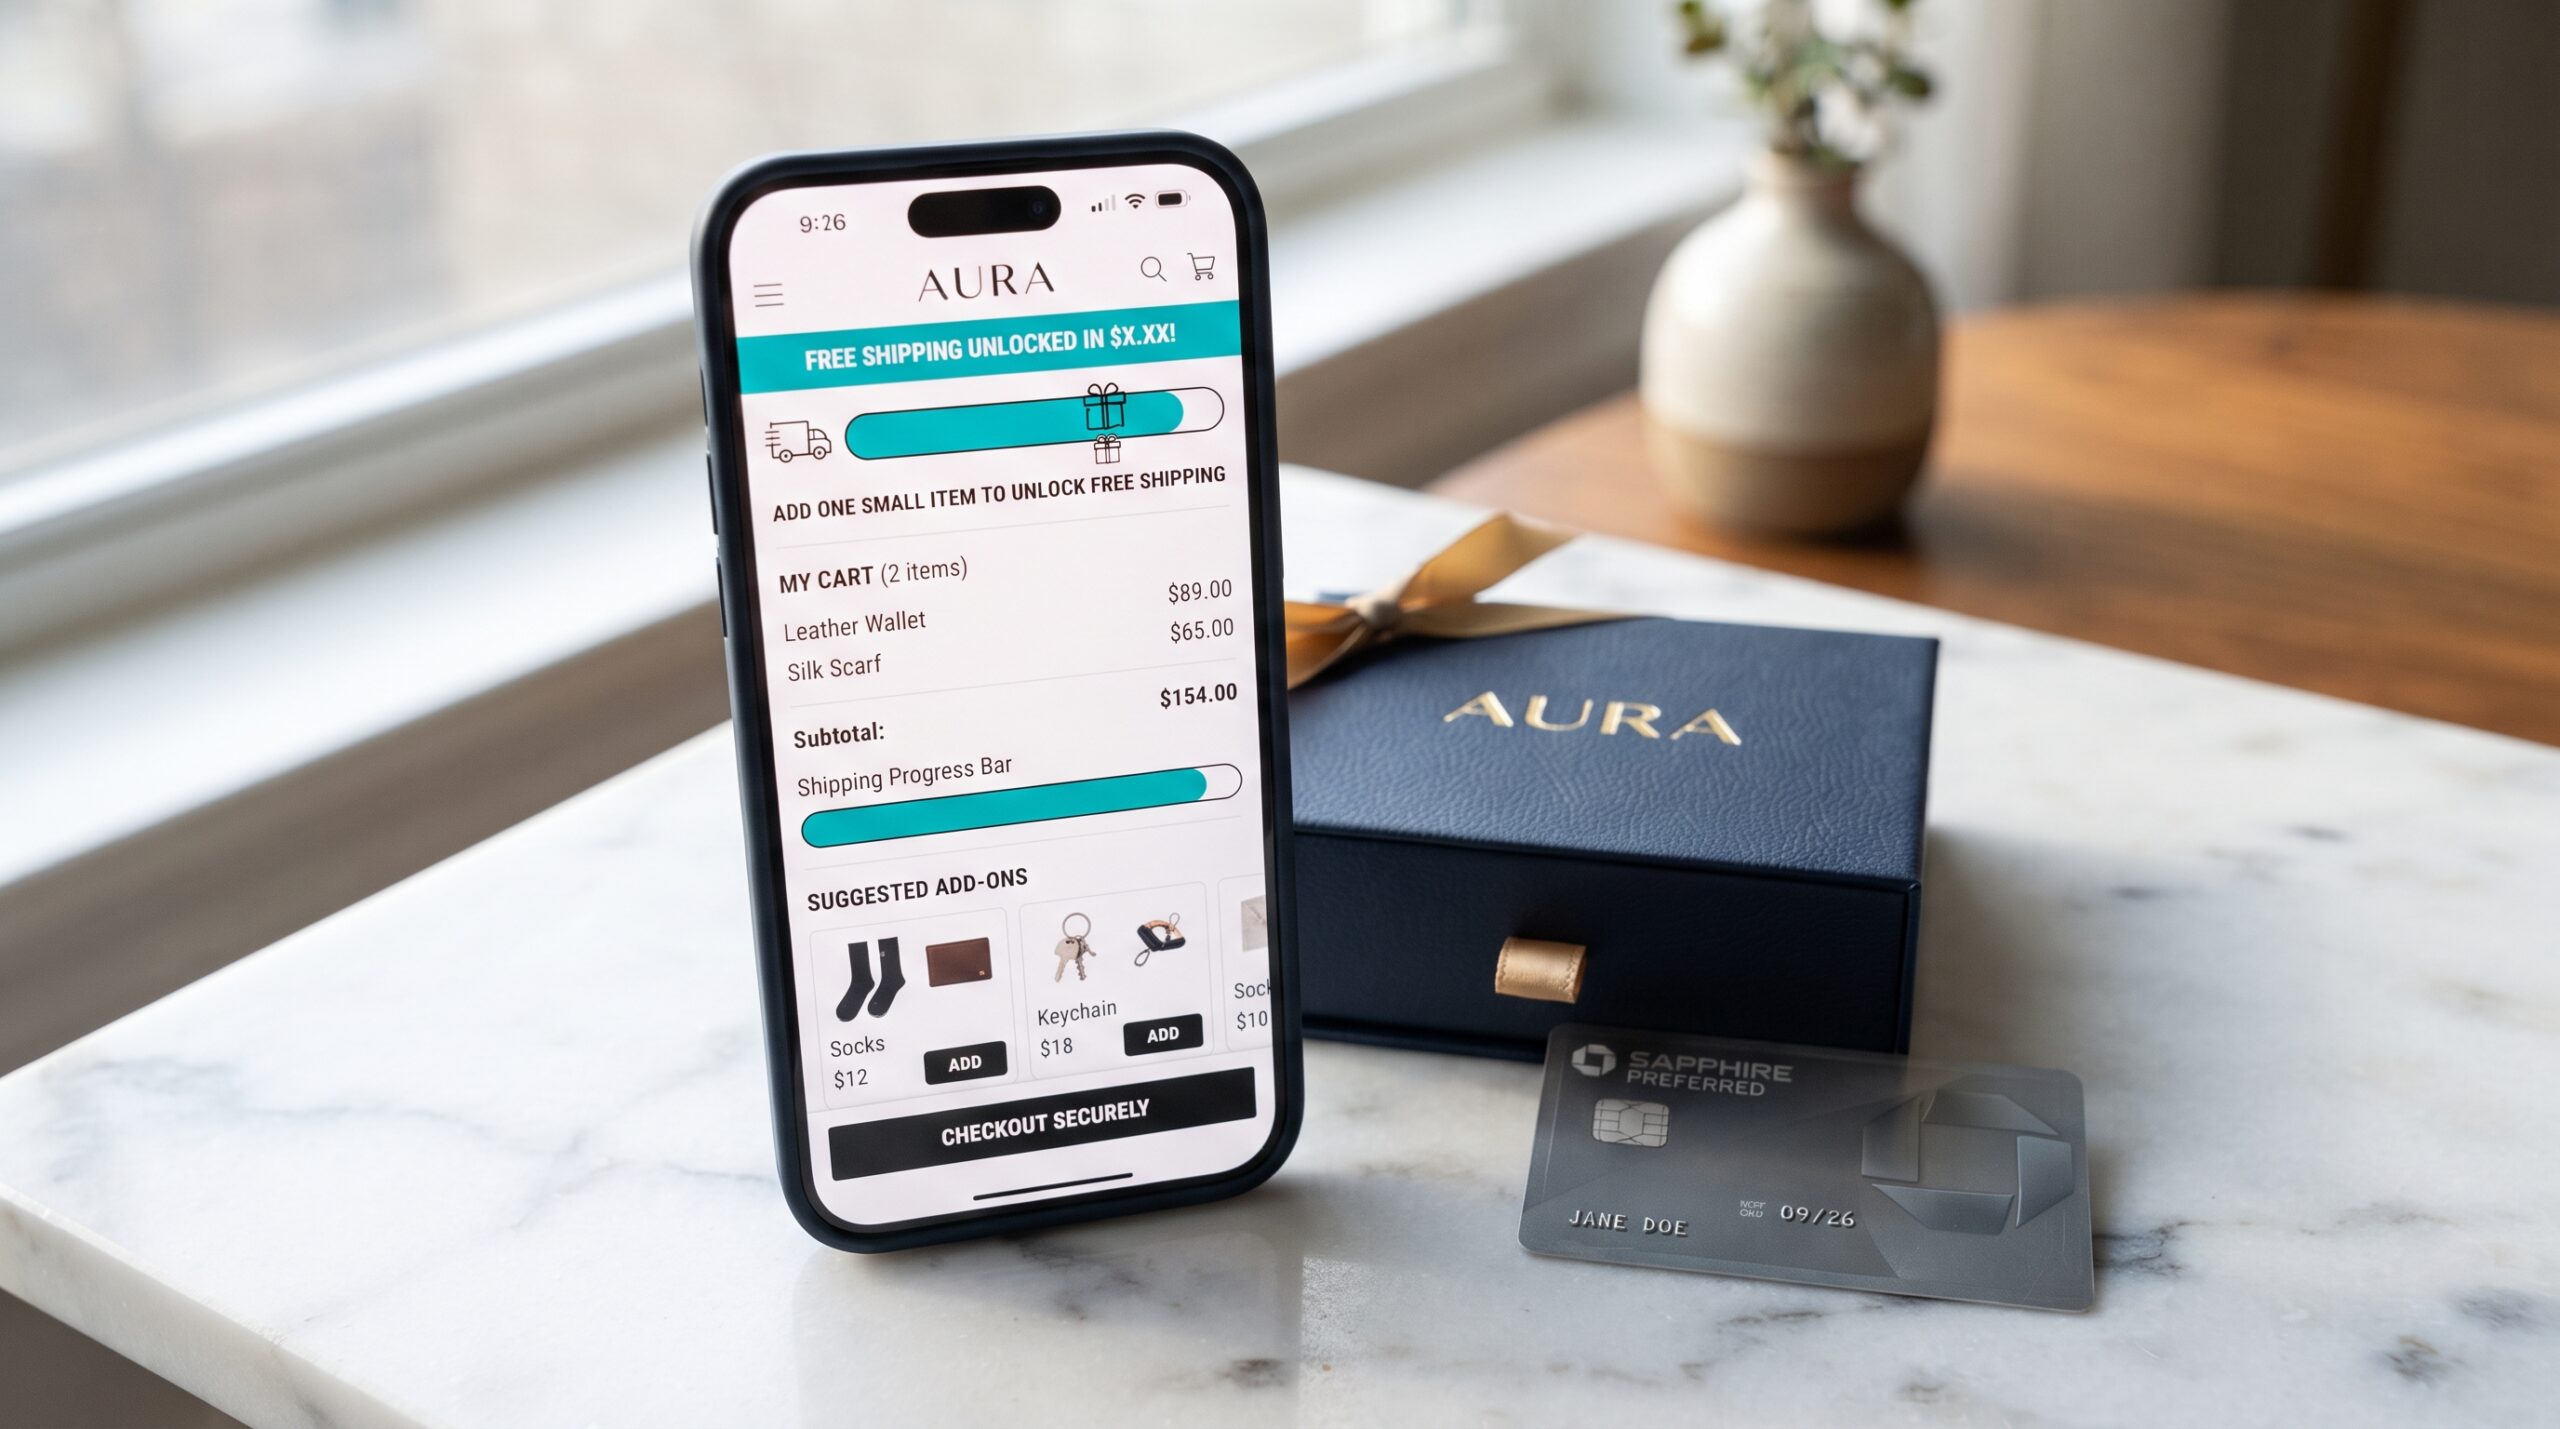






Items added to an online cart produce zero revenue until the customer completes the transaction. Tracking how to calculate cart abandonment rate across your sales channels reveals exactly where high-intent buyers drop off before placing an order-helping ecommerce brands audit their funnel and build frictionless conversion paths.
The number is useful because it connects marketing, checkout, shipping, pricing, and trust. A high abandonment rate may point to unexpected fees, unclear delivery timing, limited payment options, weak product confidence, or a checkout process that creates too much friction.

How to Calculate Cart Abandonment Rate Without Misreading the Data
Establishing a reliable benchmark for how to calculate cart abandonment rate requires defining each data input before running the math. The metric measures online carts created during a session that failed to convert into completed orders within a set timeframe.
To ensure consistency across storefronts, follow this 3-step measurement process:
Step 1: Define and Track Started Carts
Started carts represent individual shopping sessions where a user triggers at least one “Add to Cart” event. Discrepancies often arise when different analytics platforms conflate initial cart creation with checkout initiation. Establish a single event definition across your tech stack-such as a verified basket creation event-and apply it uniformly. Blending raw add-to-cart metrics from a direct storefront with checkout-start events from a third-party marketplace distorts the baseline and skews abandonment percentages.
Step 2: Filter and Audit Completed Orders
Completed orders measure the net volume of successful transactions generated within the exact same reporting window. To preserve calculation integrity, systematically exclude internal test purchases, immediate system cancellations, authorization failures, and duplicate orders. Utilizing a unified multi-channel sales tracking view helps sellers cross-reference order velocity, returns, and fulfillment performance without relying solely on isolated marketplace dashboards.
Step 3: Run the Standard Abandonment Formula
Once input definitions align across all sales channels, calculate the final percentage using this standard equation:
Cart abandonment rate = [(Started carts – Completed orders) ÷ Started carts] × 100
For example, if shoppers initiate 1,000 carts across a 30-day period and complete 280 purchases:
[(1,000 – 280) ÷ 1,000] × 100 = 72% cart abandonment rate
This result confirms that 72% of high-intent cart creation sessions exited the funnel prior to order completion, signaling clear optimization opportunities across pricing, shipping options, or checkout usability.
Separate Cart Abandonment From Checkout Abandonment
Understanding how to calculate cart abandonment rate correctly requires isolating the exact funnel stage being measured. Cart abandonment begins the moment a shopper adds an item to their basket. Checkout abandonment occurs later, after a user initiates the payment sequence but exits before completing the purchase.
These two numbers should not be mixed. Cart abandonment can include shoppers saving items, comparing prices, checking shipping, or waiting for a promotion. Checkout abandonment is closer to purchase intent and may point more directly to payment, delivery, tax, shipping, or form-field friction.
| Metric | Starting point | Ending point | What it helps diagnose |
| Cart abandonment rate | Product added to cart | Order not completed | Product confidence, shipping surprise, price comparison |
| Checkout abandonment rate | Checkout started | Payment not completed | Payment issues, form friction, delivery cost, trust barriers |
Calculate the Rate by Channel, Product, and Device
A single sitewide rate can hide the real issue. Sellers should calculate abandonment by channel, product group, device type, campaign, and shipping zone when data is available.
A branded store may have a lower conversion rate but stronger profit. A marketplace may show higher checkout intent but tighter shipping requirements. Mobile visitors may abandon more often if payment steps or delivery details are hard to review.
Segment by Channel
Calculate Amazon, Shopify, Walmart, eBay, and other storefront results separately when possible. If one channel has a much higher rate, compare its shipping cost, delivery promise, product listing detail, checkout flow, and payment options.
Segment by Product Group
If one category has high abandonment, check size guidance, compatibility details, images, reviews, return concerns, and price sensitivity. The issue may be product confidence, not checkout design.
Segment by Shipping Cost
Unexpected delivery cost is a common reason shoppers leave before purchase. A shipping cost and delivery-data review can help sellers compare carrier cost, service level, and tracking performance before changing the checkout offer.
Use the Number to Decide What to Fix First
How to calculate cart abandonment rate is only the first step. The next question is what the rate tells the team to investigate.
If abandonment rises after a shipping change, review delivery cost and delivery date messaging. If it rises on mobile, test the cart and checkout path on mobile devices. If it rises for one SKU, inspect the product promise, stock status, price, and return concerns.
| Abandonment signal | Likely review area | Seller action |
| High abandonment after shipping estimate | Delivery cost or timing | Clarify rates, thresholds, or service levels |
| High abandonment on one product | Product confidence | Improve images, variants, descriptions, or compatibility |
| High abandonment on mobile | Checkout usability | Reduce form friction and check payment flow |
| High abandonment with low stock | Availability concern | Confirm stock accuracy and delivery promise |
| High abandonment after a promo | Offer mismatch | Check discount terms, threshold, and margin |
Sellable stock visibility also matters. Shoppers may abandon when stock looks limited, delayed, inconsistent, or unavailable across channels.
Check Profit Before Reducing the Rate
A lower cart abandonment rate is not always better if the fix destroys margin. Free shipping, deeper discounts, and aggressive thresholds can increase completed orders while reducing profit.
Before changing offers, compare the recovered orders against shipping cost, marketplace fees, return risk, advertising spend, and product margin. A profit impact by channel review helps sellers decide whether a checkout improvement supports real growth or only increases low-margin orders.
Avoid Common Calculation Mistakes
Sellers often misread abandonment because they use unclear inputs. Do not compare add-to-cart data from one platform with checkout-start data from another and treat the result as equal.
Also avoid judging one day of data too quickly. Promotions, paydays, ad campaigns, holidays, and competitor pricing can change shopper behavior. Review trends across a useful period, then compare them with shipping changes, stock status, product-page updates, and campaign timing.
Calculating cart abandonment rate effectively serves as the operational baseline-the real strategic value comes from a standardized tracking framework that transforms drop-off data into actionable profit improvements.
Turn Abandonment Data Into Margin-Conscious Growth
Knowing how to calculate cart abandonment rate gives sellers clear visibility into where high-intent shoppers drop off. However, isolating the raw percentage is only the first step-sustainable recovery requires cross-referencing lost carts against shipping fees, inventory availability, and product margins.
Crazy Vendor unifies multi-channel sales tracking, inventory management, order fulfillment, and profit analytics-giving ecommerce brands the underlying data needed to optimize conversion rates without sacrificing net profitability.