


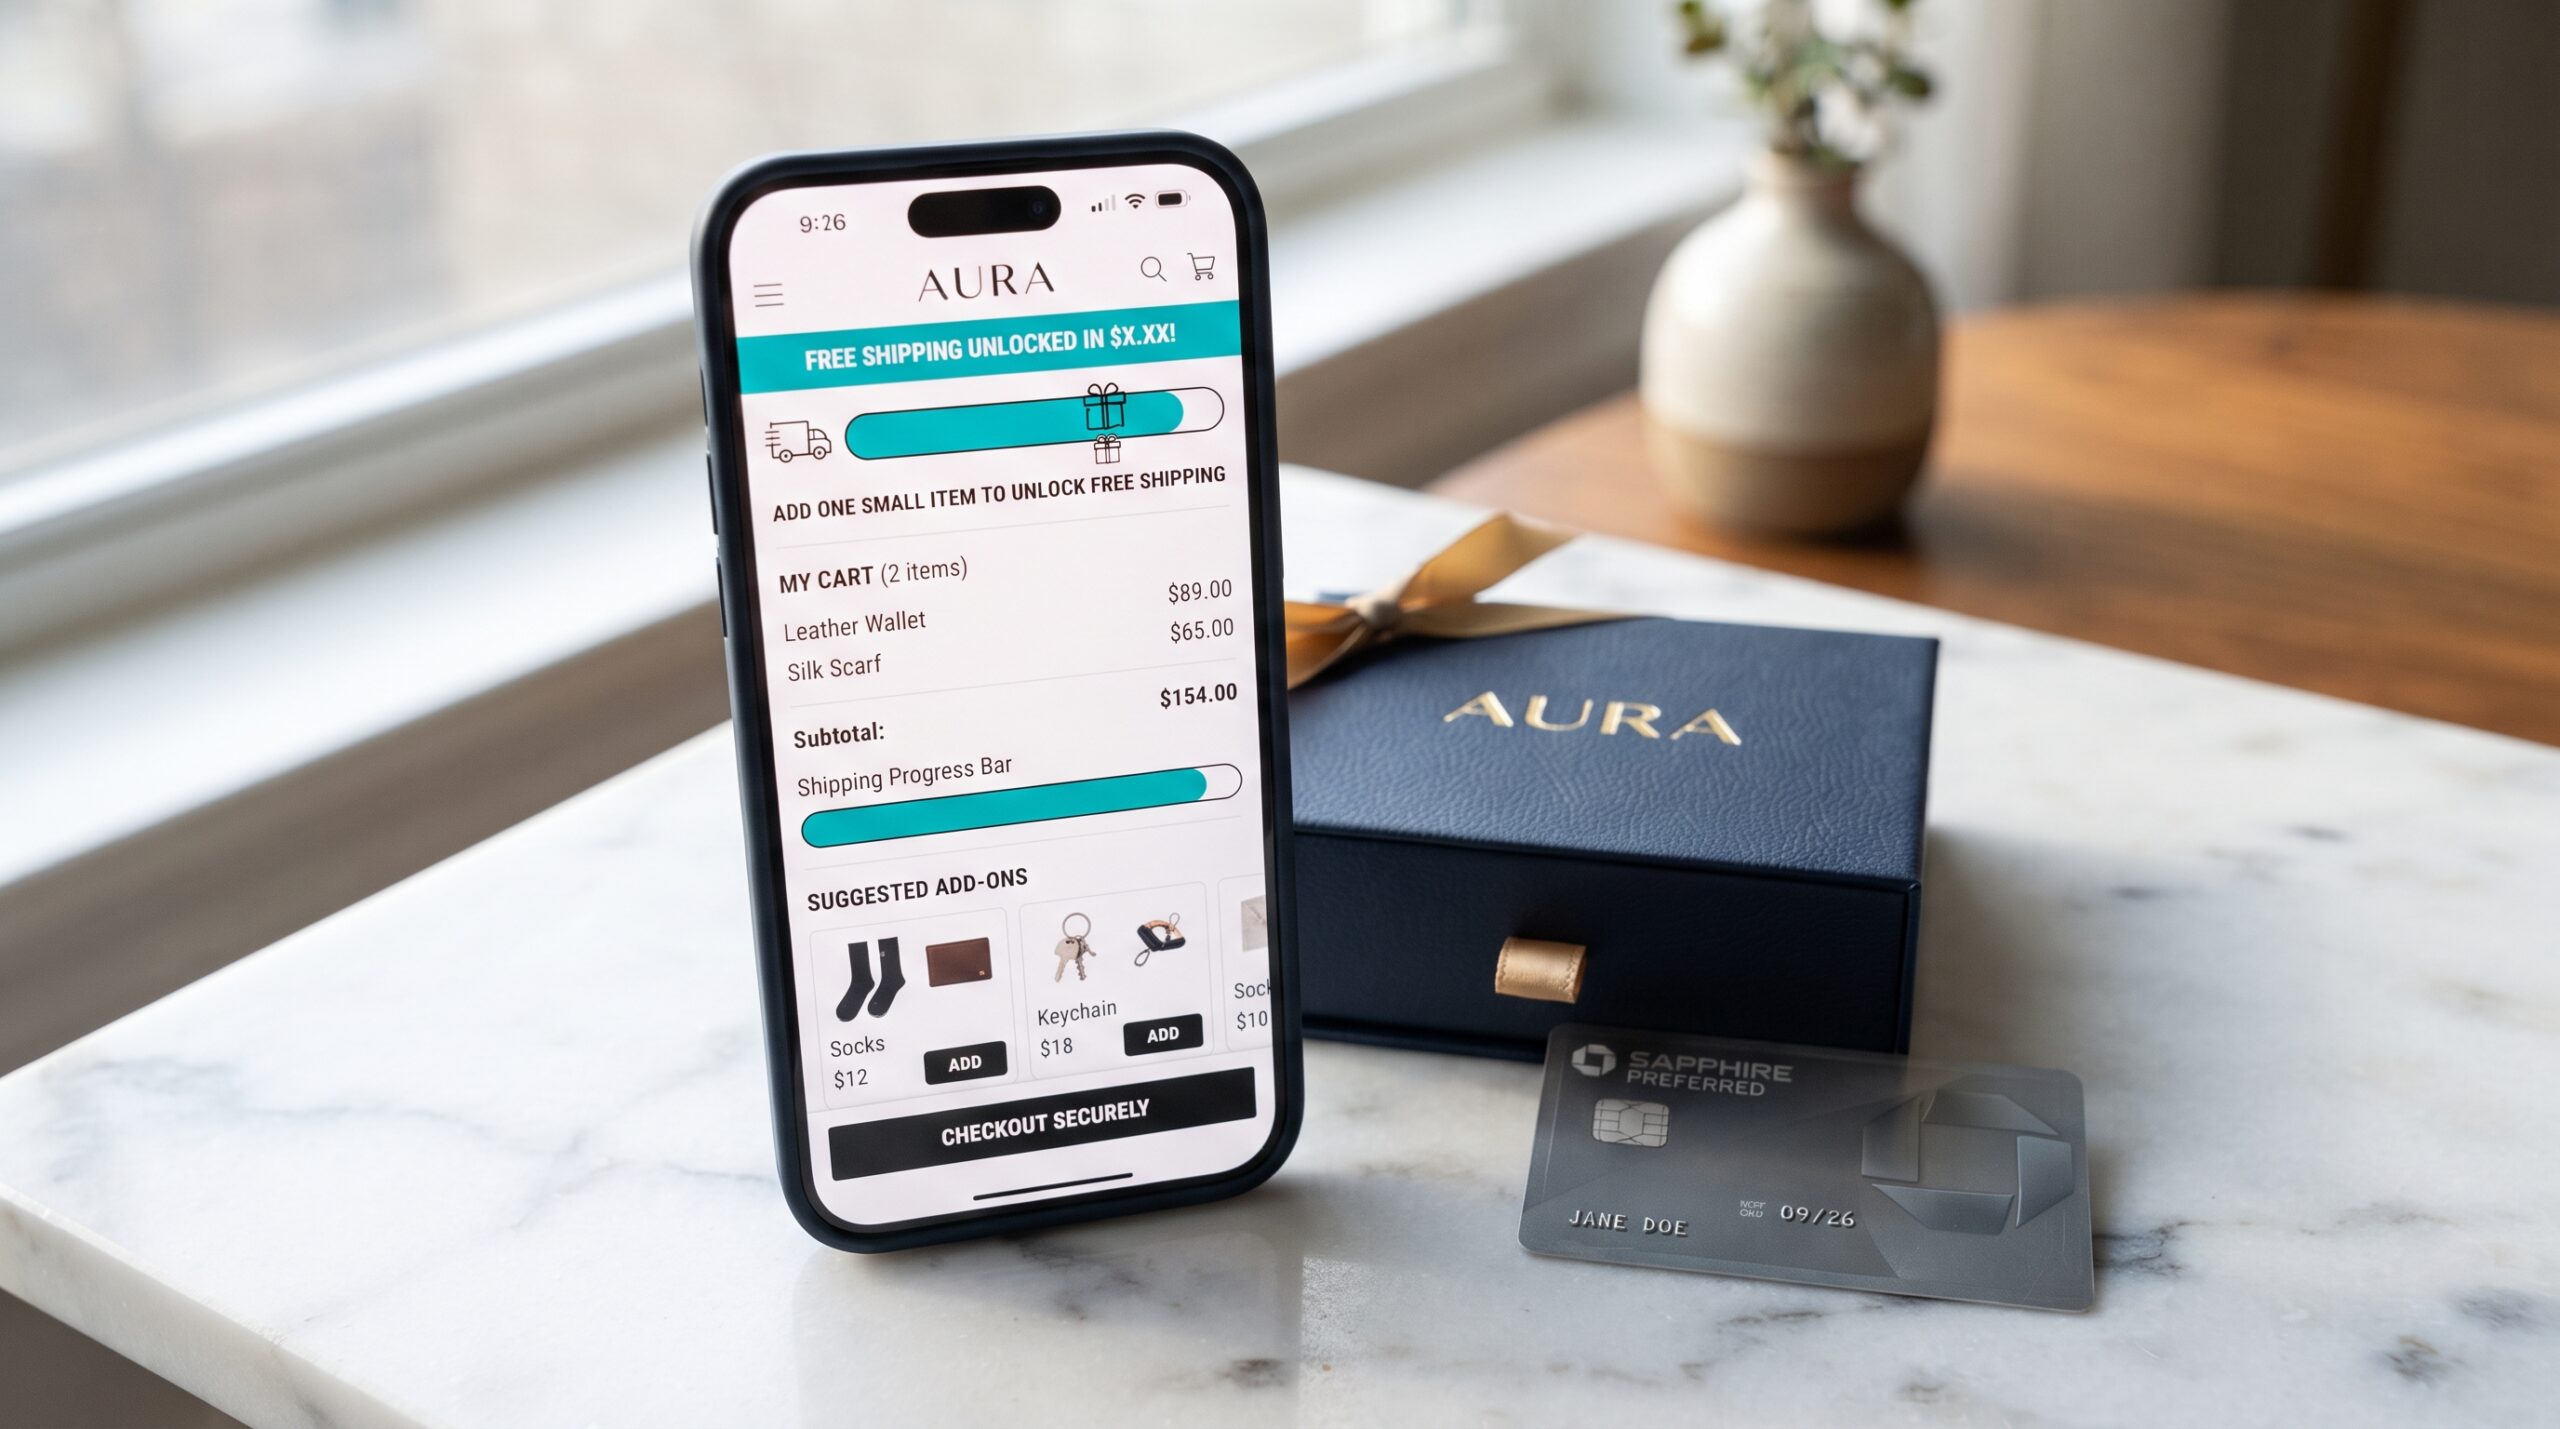






Average order value looks straightforward on the surface, but flawed calculations distort pricing strategies, bundle profitability, and shipping thresholds. Getting a clear picture of how to calculate AOV requires looking past surface-level math to ensure revenue inputs, order statuses, and platform-specific exclusions reflect actual business margins.
For ecommerce sellers, AOV should explain how much a customer spends per completed order during a defined period. When reviewed properly, it helps teams understand basket size, channel performance, bundle strength, discount impact, and profit risk.

How to Calculate AOV Correctly
The foundational framework for how to calculate AOV relies on a clean ratio:
AOV = Total Net Order Revenue ÷ Total Completed Orders
For example, if a store generated $24,000 from 600 completed orders in one month:
$24,000 ÷ 600 = $40 AOV
While this establishes your baseline, remember that high-value wholesale transactions or single bulk purchases can skew overall averages higher than typical consumer checkouts.

Decide What Counts Before You Calculate
The formula only works when the inputs are consistent. Sellers should define the date range, revenue type, order status, channel, and exclusions before comparing one AOV result against another.
AOV should not mix different reporting methods. A Shopify store, Amazon account, and Walmart account may show revenue differently depending on tax, shipping, discounts, refunds, and canceled orders.
1. Choose the Reporting Period
Use a period that matches the decision. A daily AOV can help monitor a campaign or product launch. A weekly AOV can show short-term buying behavior. A monthly AOV is better for pricing, bundle, and channel comparisons.
Do not judge one unusual day as a trend. Paydays, promotions, holidays, stockouts, and ad changes can temporarily lift or lower the number.
2. Define Revenue Clearly
Decide whether total revenue includes shipping fees, taxes, discounts, refunds, or gift cards. For most sales decisions, sellers should track gross AOV and net AOV separately.
Gross AOV shows the size of the order at checkout. Net AOV shows the value after discounts, refunds, or adjustments. A sales-performance tracking view helps sellers compare order count, sales velocity, refunds, and channel results without depending on separate marketplace reports.
3. Count Completed Orders Only
Use completed orders for the denominator. Exclude abandoned carts, failed payments, test orders, duplicate orders, and canceled orders when they do not represent real customer purchases.
If a seller includes canceled orders in the order count, AOV may look lower than it actually is. If refunds remain inside revenue, AOV may look stronger than the business truly earned.
Calculate AOV by Channel, Not Only Storewide
A storewide number can hide what is really happening. How to calculate AOV becomes more useful when sellers calculate it by channel, product group, customer segment, and campaign.
A marketplace may produce smaller orders but higher volume. A direct store may produce larger baskets because buyers add accessories, refills, or bundles. A wholesale portal may raise the average, but it should not be compared directly with consumer orders.
| Segment | Why calculate AOV separately? | What to check next |
| Sales channel | Shows whether Amazon, Shopify, Walmart, or eBay drives larger orders | Fees, shipping cost, returns, and margin |
| Product category | Reveals which categories encourage larger baskets | Bundles, add-ons, and product mix |
| Campaign | Shows whether a promotion increased order size | Discount cost and repeat purchase behavior |
| Customer type | Separates new buyers from repeat buyers | Retention, loyalty, and reorder patterns |
| Device type | Compares mobile and desktop basket value | Checkout friction and add-on visibility |
Never rely on a single blended metric across multi-channel operations. Review channel-specific and category-level order trends to identify exactly which catalog segments drive basket expansion.
Compare AOV With Profit Before Making Changes
Higher AOV is not automatically better. A large basket can still have weak profit if it depends on heavy discounts, high shipping cost, low-margin add-ons, or frequent returns.
A SKU and channel margin review helps sellers compare revenue with marketplace fees, shipping costs, advertising spend, refunds, COGS, and fulfillment expenses. This prevents teams from celebrating a higher AOV that actually reduces net profit.
| AOV movement | Possible cause | Profit check |
| AOV increased | Bundle or threshold worked | Did discount and shipping cost reduce margin? |
| AOV decreased | More single-item orders | Are those orders still profitable? |
| AOV increased with returns | Buyers may misunderstand the offer | Review product promise and return reasons |
| AOV stable but sales increased | More order volume, not larger baskets | Check fulfillment and support workload |
| AOV increased on one channel | Product mix shifted | Compare channel fees and net contribution |
Use AOV to Improve Basket Strategy
Once the number is clean, sellers can use it to make practical decisions. AOV can guide bundles, add-ons, free-shipping thresholds, minimum order offers, and product-page recommendations.
4. Set Thresholds Near Current Buying Behavior
A free-shipping or discount threshold should be close enough to feel reachable. If the current AOV is $46, a $55 threshold may encourage one useful add-on. A $90 threshold may reduce conversion because buyers feel pushed too far.
Check package size and carrier cost before using thresholds. A larger order can become less profitable if it moves into a more expensive shipping bracket.
5. Match Add-Ons to the Product
Add-ons should help the customer complete the purchase. Recommend accessories, refills, replacement parts, warranties, or compatible products only when they make sense with the item already in the cart.
AOV growth should not create buyer confusion. If add-ons increase returns or support tickets, the offer may be too broad or poorly explained.
Connect AOV to Inventory and Order Flow
Knowing how to calculate AOV across operational workflows is critical for supply chain planning. A promo campaign designed to expand basket size directly impacts bundled stock requirements, packaging options, and warehouse picking capacity.
Available-stock visibility helps sellers confirm whether the products used in bundles, thresholds, or add-ons can actually support the offer. If the add-on SKU sells out quickly, the AOV strategy may create missed sales or fulfillment delays.
AOV should also be checked alongside order issues. A centralized order review process helps teams watch cancellations, holds, returns, and fulfillment exceptions that can distort the final value of completed orders.
Avoid Common AOV Calculation Mistakes
The most common mistake is using revenue and order counts from different sources. Do not divide website revenue by all marketplace orders or compare one channel’s gross AOV with another channel’s net AOV.
Also avoid including tax, shipping, refunds, and discounts inconsistently. If those items are handled differently across platforms, label the calculation clearly before using it for decisions.
How to calculate AOV correctly is not only a math task. It is a reporting habit that helps sellers trust the number before they change prices, bundles, shipping thresholds, or channel strategy.
Leverage Order Data to Drive Profitable Basket Growth
Aligning your growth strategy with how to calculate AOV correctly requires segmented, clean transactional inputs rather than surface-level marketplace totals. Before adjusting shipping thresholds or launching bundle promotions, review basket metrics alongside channel fees, fulfillment costs, and net margin impact.
Crazy Vendor integrates multi-channel order tracking, inventory management, and profit analytics into one central dashboard-giving high-growth brands absolute financial clarity across every transaction.